A ripple animation in JavaScript
I wanted to create a ripple animation recently but I had a hard time finding an online explanation that fit my needs. That post didn’t exist so I decided to write it. I hope it helps someone!
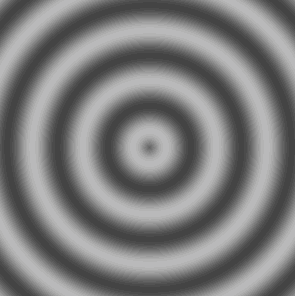
We’d like to build a ripple animation like this one:
Eventually, we’ll be drawing this ripple in Javascript, but the primary goal of this post is to walk through the math behind the animation, step by step. If we can understand how the math works, we can create the animation, change it without fear, and build other similar animations using JavaScript or any other programming language.
The ripple as a sine wave
This ripple is based on a sine wave.
As a reminder, sine is a mathematical function that looks like this:
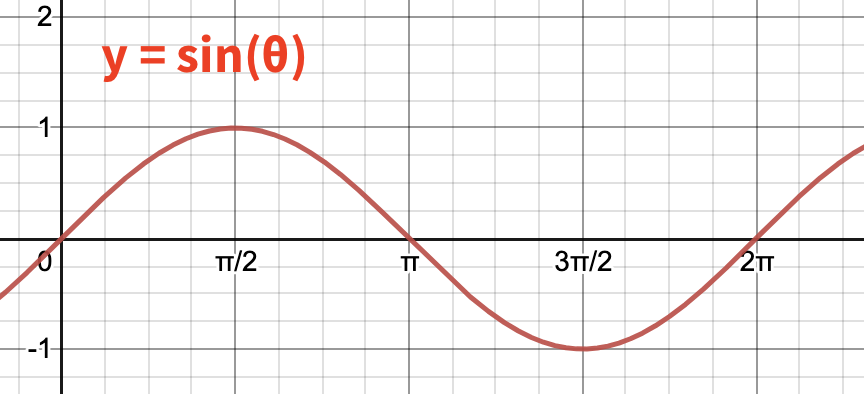
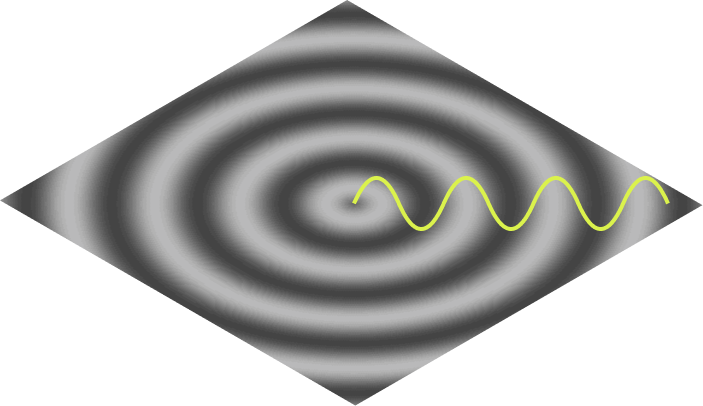
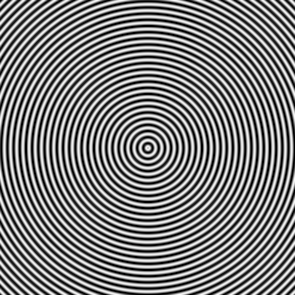
The ripple we are building is viewed from the overhead perspective, but if we placed our eye level at the surface of the water, we’d see that the shape of the ripple’s surface matches the sine wave:
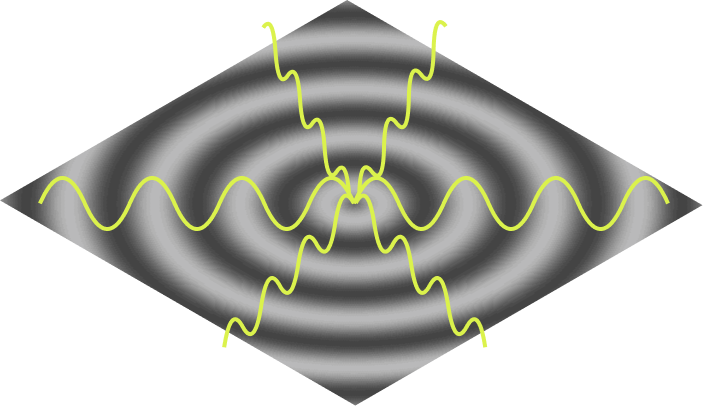
The full shape of the ripple can be represented with many sine waves, beginning at the center and emanating out in all directions:
So we can see the sine waves in our ripple, but how do we draw it with code?
Understanding our coordinates
Many graphics programming environments like HTML5 Canvas give you a coordinate system with the origin in the top-left, like this:
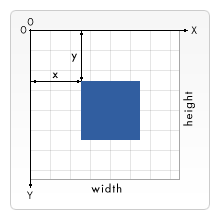
Since our ripple has a clear center in the middle, it would be more convenient to move our origin to the center, like this:
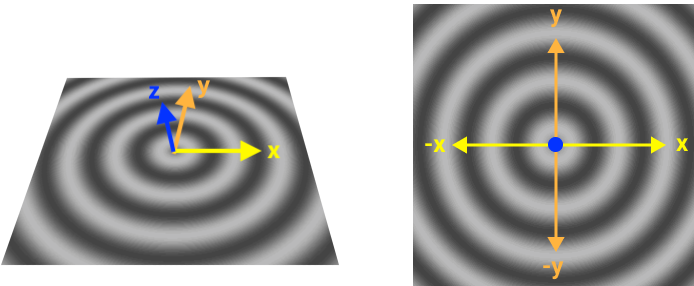
In this system, a sine wave travelling down the X-axis would move up and down the Z-axis as it went (with Y staying at 0 the whole time). This wave could be defined by this function:
z = sin(x)
For any x we provide, the function gives us z, the elevation of the wave at that location. Since our image is 2D (being viewed from overhead), we’ll plan on mapping our z value to color (instead of position), making the larger z’s lighter and the smaller z’s darker.
Calculating every pixel
z = sin(x) works fine for waves on travelling down the X-axis, but what about the rest of the scene?
Many graphics environments (like Canvas and WebGL) work by looping through each pixel and giving you a chance to calculate what it should look like. With that in mind, lets look at a random pixel in our scene:
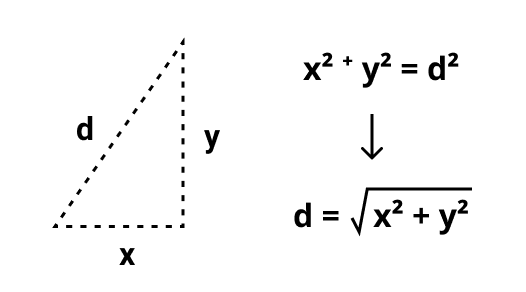
As you can see, this pixel lives at the location (x, y), which makes two sides of a right triangle.
Consider this: the hypotenuse of this triangle, is the path of this pixel’s sine wave.
This means that if we knew the length of the hypotenuse, we could drop that distance into our sine function and get the correct wave elevation at that pixel. This works for every pixel in the scene, so now we can generalize our sine function:
# Where d represents the distance between any point and the origin.
z = sin(d)
We can calculate d for any pixel by using Pythagorean’s theorem to find the length of the hypotenuse:
Now we have all of the mathematical pieces we need to draw the ripple. 🙌
Drawing the ripple in JavaScript
We’ll start by just drawing the non-animated ripple, using the Canvas API. Specifically, we’ll use createImageData, which allows us to draw an image, one pixel at a time. Here’s the setup:
HTML:
<canvas id="canvas" width="300" height="300"></canvas>
JAVASCRIPT
const canvas = document.getElementById('canvas');
const ctx = canvas.getContext('2d');

function drawRipple() {
  const pixelData = ctx.createImageData(canvas.width, canvas.height);

  // @todo: manipulate the the pixelData here

  ctx.putImageData(pixelData, 0, 0);
}

drawRipple();
This doesn’t render anything to the canvas yet. We can look at pixelData to see why:
console.log(pixelData);

…

{
  width: 300,
  height: 300,
  data: [0, 0, 0, 0, 0, 0, 0, 0, 0, 0, 0, 0, 0, 0, 0, …]
}
pixelData.data is a single array (technically, a Uint8ClampedArray) containing all the pixel data in our 300x300 image. Each set of four numbers represents the RGBA color values for a given pixel:
[ R, G, B, A,  R, G, B, A,  R, G, B, A, …]
 └─ Pixel 1 ─┘└─ Pixel 2 ─┘└─ Pixel 3 ─┘
Thus, when the array is full of 0s, we end up with a 300x300 transparent black image.
Now, lets loop over the array and change the pixel values to draw our ripple:
function drawRipple() {
  const pixelData = ctx.createImageData(canvas.width, canvas.height);

  // Step through the array one pixel at a time
  for (let i = 0; i < pixelData.data.length; i += 4) {

    // We can find our (x, y) position on the canvas by comparing
    // our position in the array with the width of the canvas.
    let x = Math.floor(i / 4) % canvas.width;
    let y = Math.floor(i / (4 * canvas.width));

    // We need our origin to be in the center, so lets convert the (x, y)
    // from above (the "canvas coordinates") to their "reindexed" values
    // (what they would become if the origin were in the center).
    let reIndexedX = -((canvas.width - x) - (canvas.width / 2));
    let reIndexedY = (canvas.height - y) - (canvas.height / 2);

    // Instead of writing our own code for Pythagorean's theorem, we can
    // use JavaScript's built-in method to calculate the hypotenuse.
    let distance = Math.hypot(reIndexedX, reIndexedY);
    let waveHeight = Math.sin(distance);

    // Normally, a sin wave fluctuates between -1 and 1, but we want ours
    // to fluctuate between 0 and 255 instead (the range for RGB values).
    // Lets adjust the wave height to produce that 0-255 range.
    let adjustedHeight = (waveHeight * (255/2)) + (255/2);

    // Assign the adjustedHeight to R, G, and B equally, to make gray.
    pixelData.data[i]     = adjustedHeight; // red
    pixelData.data[i + 1] = adjustedHeight; // green
    pixelData.data[i + 2] = adjustedHeight; // blue
    pixelData.data[i + 3] = 255;            // opacity
  }

  ctx.putImageData(pixelData, 0, 0);
}
This is what we get:
It looks we need to make a few minor adjustments to our sin wave. For things like this, I highly recommend desmos.com online graphing calculator. They’ve got a great example sin function that allows you to tweak all the variables.
These were all the changes I needed:
- let waveHeight = Math.sin(radialX);
+ let waveHeight = Math.sin(radialX / 8);
- let adjustedHeight = (waveHeight * (255/2)) + (255/2);
+ let adjustedHeight = (waveHeight * 60) + (255/2);
Animating the ripple
To see how to animate it, we can again turn to desmos.com to see which variables of the sine wave we should change over time:
To animate the wave in JavaScript, we can use requestAnimationFrame to repeatedly call our drawRipple() function, and pass in a timestamp to adjust the wave position each time. Doing this only requires a few changes to our function above:
const startTime = performance.now();

(function drawRipple(timestamp) {
  const elapsedTimeUnits = (timestamp - startTime) / 50;

  ⋮

  // Update the sin() function with a value based on the timestamp
  // For reference, see https://www.desmos.com/calculator/bp9t79pfa0
  let waveHeight = Math.sin((radialX - elapsedTimeUnits) / 8);

  ⋮

  requestAnimationFrame(drawRipple);
})(startTime);
And with that, our animation looks like this:
Future enhancements
Theres a lot more we could do to enhance the animation. For example:
- Change the color values to create a blue “water-like” ripple or a psychedelic rainbow ripple.
- For example, here’s one I made with different colors
- Allow the user to click to define a new “center” location for the ripple.
- Attenuate the ripple so the waves die down the further they get from the center.
- I played around with this on Desmos.com and here’s what that looks like mathematically. Isn’t Desmos great?
- Try animating it using Processing, Tixy.land, or Checkboxland.
- See if you can figure out how to turn the ripple into a spiral.
As long as you understand the underlying math, you can tweak and adjust the animation to your heart’s content.
Note: For a different approach to programming a ripple, see this video tutorial by Daniel Shiffman. In it he uses a “neighboring pixels” algorithm instead of sine waves, which produces some neat effects (like the ability for waves to reflect off walls). Check it out!