Drawing git branching diagrams
I recently needed to create a git branching diagram to document the workflow for my team at Sparkbox. I hadn’t done this before, so I did a little research on what tools I should use to draw it.
The options seemed to fall into two categories: Diagramming tools and git visualization tools.
Diagramming tools
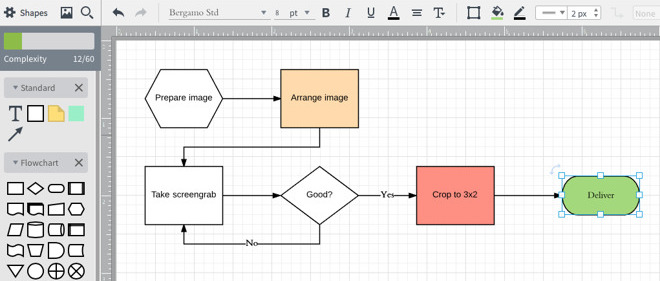
Options: Omnigraffle, Gliffy, Diagrams.net, LucidChart, etc.
What I learned: Git branching diagrams aren’t a common use-case for these tools, so they didn’t tend to have build-in patterns or shapes designed for this.
Git visualization tools
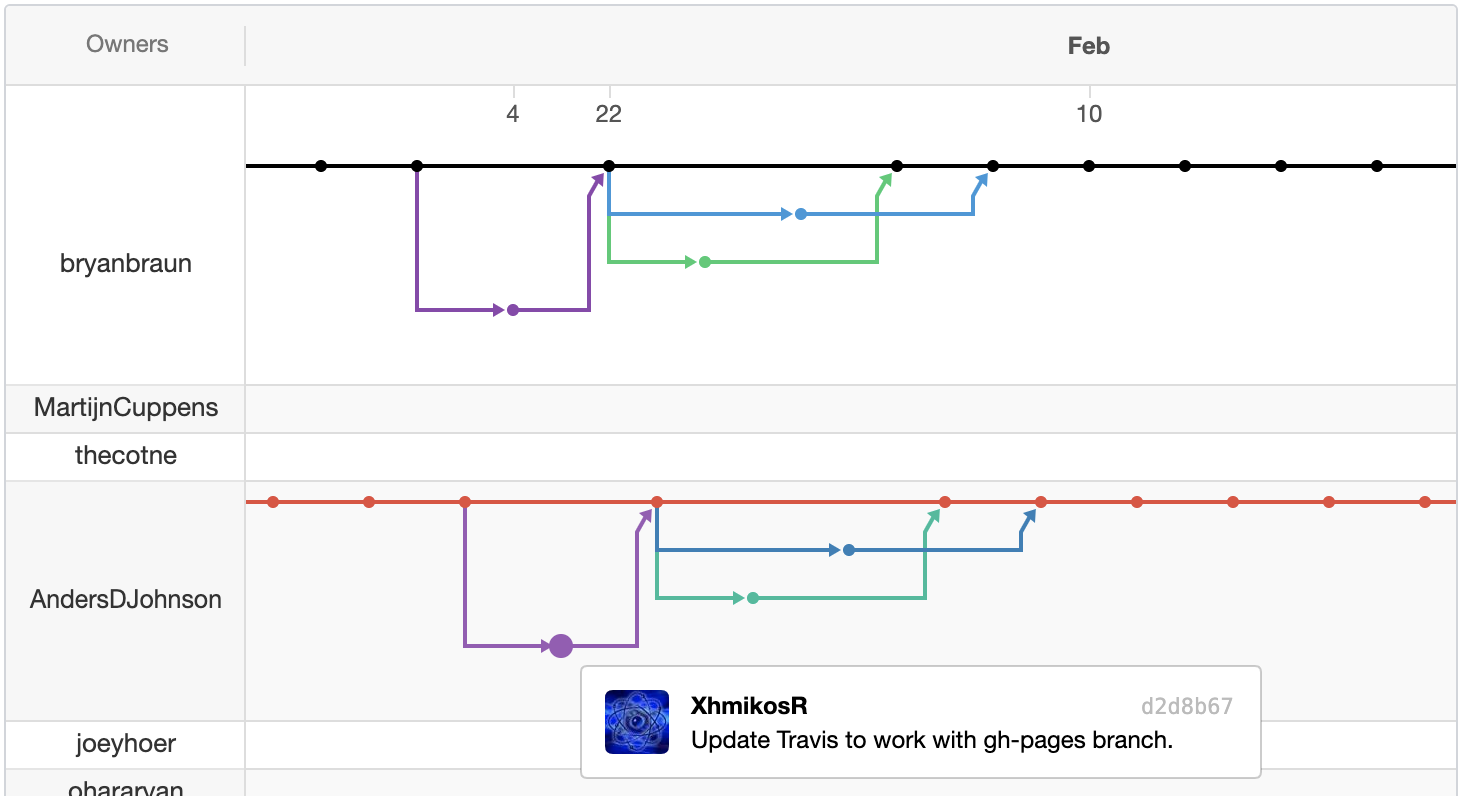
Options: GitGraph.js, Git up, Git Flow Chart, etc.
What I learned: The visualizations looked great, but they seemed pretty rigid and difficult to customize or annotate.
What I ended up doing
I found some nice-looking branching diagrams published by Mobify, which they made with diagrams.net. I was able to take their export, clean it up a little, and use it as a starting place for my own. It worked great.
I wanted a generic template that I could use for future projects, so I threw one together and published it with some basic instructions.
Here’s the link to my git branching diagram template. It looks like this:
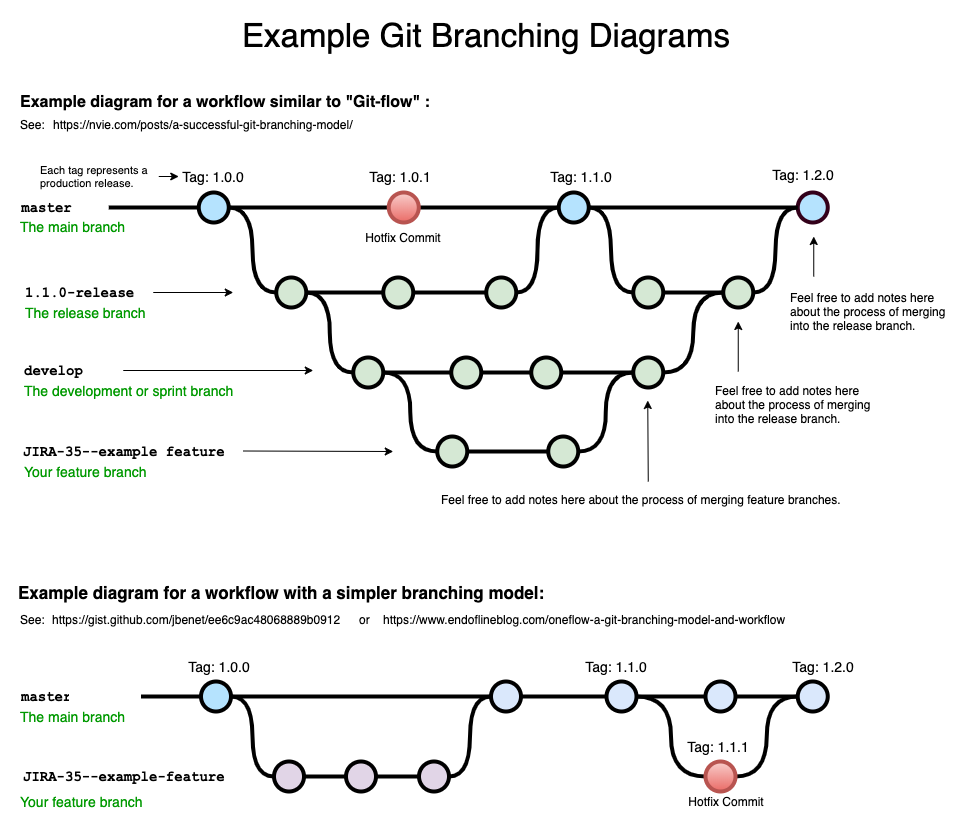
Feel free to use it as a starting place for your own branching diagrams, if you’d like. 😄